Page 11 - Active Export E-Program - Furniture Sector
P. 11

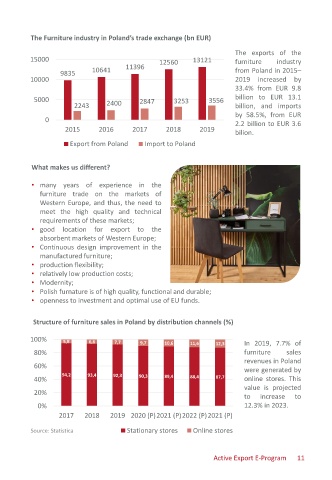
The Furniture industry in Poland’s trade exchange (bn EUR)

                                                                              The exports of the
           15000                                     12560      13121         furniture    industry
                                          11396
                               10641                                          from Poland in 2015–
                     9835
           10000                                                              2019   increased   by
                                                                              33.4% from EUR 9.8

            5000                              2847        3253       3556     billion to EUR 13.1
                         2243       2400                                      billion, and imports
                                                                              by 58.5%, from EUR
                0
                                                                              2.2 billion to EUR 3.6
                      2015       2016       2017       2018       2019
                                                                              bilion.
                        Export from Poland      Import to Poland


           What makes us different?


           • many years of experience in the
              furniture trade on the markets of
              Western Europe, and thus, the need to
              meet the high quality and technical
              requirements of these markets;
           • good    location   for  export   to  the
              absorbent markets of Western Europe;
           • Continuous design improvement in the
              manufactured furniture;
           • production flexibility;
           • relatively low production costs;
           • Modernity;
           • Polish furnature is of high quality, functional and durable;
           • openness to investment and optimal use of EU funds.


            Structure of furniture sales in Poland by distribution channels (%)

           100%       5,8     6,6     7,7      9,7     10,6    11,6    12,3     In 2019, 7.7% of

            80%                                                                 furniture     sales
                                                                                revenues in Poland
            60%
                                                                                were generated by
                     94,2     93,4    92,3    90,3     89,4
            40%                                                88,4    87,7     online stores. This
                                                                                value is projected
            20%
                                                                                to    increase   to
             0%                                                                 12.3% in 2023.
                    2017     2018    2019 2020 (P)2021 (P)2022 (P)2021 (P)

           Source: Statistica             Stationary stores     Online stores


                                                                       Active Export E-Program    11
   6   7   8   9   10   11   12   13   14   15   16